

From LANDR
Fletcher-Munson Curves: How Equal Loudness Contours Affect How You Mix
Your experience of music is more than just vibrations travelling through the air. Fletcher-Munson Curves explain why.
As soon as a sound reaches your ears, a complex process turns the sound waves into music you can perceive and understand.
Fundamental features of music like pitch and timbre and are wired into your brain’s perception and cognition systems.
Even a psychoacoustic phenomenon as simple as loudness can be a bit mysterious.
Fletcher-Munson Curves are a tool for evaluating how you experience sound. The effect they describe has a big impact on your approach to mixing music.
In this article you’ll learn what Fletcher-Munson Curves are and how to use them to help you understand loudness.
What are Fletcher-Munson curves?
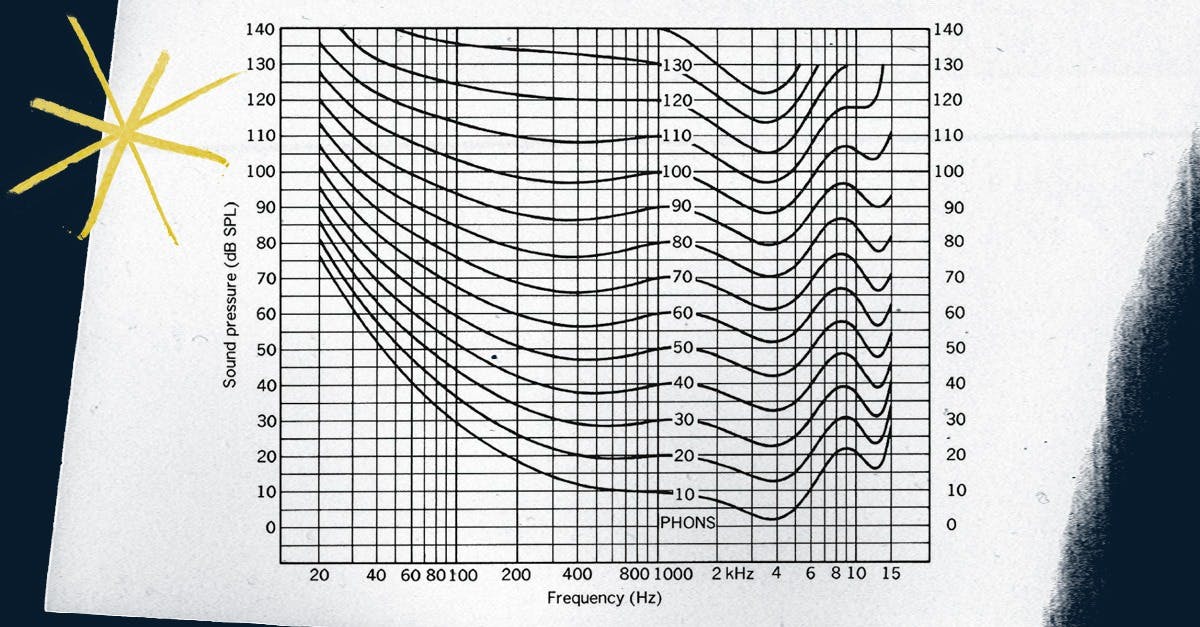
Fletcher-Munson curves are equal-loudness contours. Equal-loudness contours describe the perceived loudness of a sound in relation to its frequency for human listeners.
Equal-loudness contours describe the apparent loudness of a sound in relation to its frequency for human listeners.
This scale is important because human loudness perception is extremely sensitive to differences in frequency.
The original Fletcher-Munson curves were created from experimental measurements made by Harvey Fletcher and Milden A. Munson in the 1930s.
But they’ve since been replaced by a series of generic equal-loudness contours like the modern ISO 226:2003 which better represent human hearing as a whole.
Human hearing and the cochlea
Why does perceived loudness depend so much on frequency? Why does a 60 dB sine wave at 10 kHz seem so much louder than at 50 Hz?
Why does a 60 dB sine wave at 10 kHz seem so much louder than at 50 Hz?
The answer has to do with your ears—and your brain.
After a sound wave enters your ear canal, your eardrum transmits the vibrations to the fluid in your inner ear with small bones called ossicles.
Inside your inner ear these vibrations excite special hair cells called the stereocilia which create the electrical signals that travel through the auditory nerve to your brain.
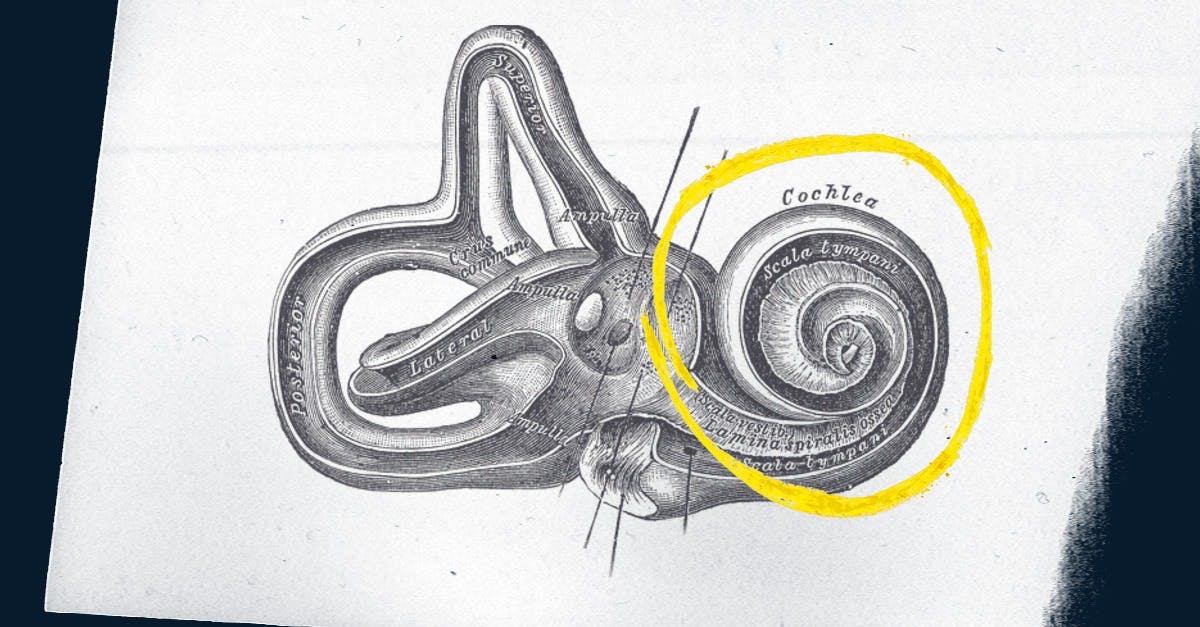
The organ inside your ear where all this takes place is called the cochlea—and it’s shaped like a coiled up garden hose.
Our powerful, AI-driven mastering engine listens to your song and delivers pristine, studio-quality music that’s ready for release. Master a track.
Here’s where it gets interesting…
The hair cells are distributed differently throughout the cochlea. They’re closer together near the centre where the tube is coiled up the tightest and the highest frequencies are handled.
In fact, if you were to unroll the cochlea, you’d find that the distribution of hair cells mimics the same kind of logarithmic scale that we use to measure sound pressure level (SPL).
That means that at least some part of the perceived loudness puzzle is physiological—it’s basically built-in to your body!
The Fletcher-Munson curves were discovered by measuring people’s subjective experience. They were created to come up with ways to compensate for the differences in loudness throughout the spectrum.
Phons and sones
The next logical step in the quest for equivalence in loudness was to use the curves to create standard units.
The decibel scale works fine for SPL, but engineers needed something better for perceived loudness.
The decibel scale works fine for SPL, but engineers needed something better for perceived loudness.
If you follow the lines, the perceived loudness at each position along the curve is the same— despite the decibel difference.
That means by using an 1000 Hz sound at 1dB as a reference, engineers could define a unit of perceived loudness called the phon.
Researchers soon realized that an increase of 10 phons was equivalent to a perceived doubling of loudness.
This gave rise to a another proposed loudness unit called the sone. On this scale, each additional doubling of perceived loudness is a doubling in value.
Equal loudness curves in mastering
All this psychoacoustic research into quantifying loudness has a big impact on your masters.
Using equal-loudness curves and the concept of phons and sones, engineers developed Loudness Units relative to Full Scale (LUFS)—the standard for the perceived loudness of signals inside your DAW.
This is what enables mastering engineers to push levels exactly the right loudness to excite your ears.
And it’s part of the technology that makes precise volume matching possible.
Matching levels accurately is one of the most important factors to consider for good mix referencing.
Matching levels accurately is one of the most important factors to consider for good mix referencing.
When comparing your original track to the master, use volume matching to help you make the most informed decision about your masters.
For example, hear how a track mastered with LANDR’s AI mastering tool compares in volume to an unmastered track.
Try LANDR Mastering on Your Own Tracks
When mix referencing both versions with volume matching, listen for details like:
- Overall EQ contour
- Overall dynamics
- Level and frequency range of each element
Ahead of the Fletcher-Munson curve
The Fletcher-Munson curve was one of the first music perception experiments to have an impact on music producers and engineers.
The data they gathered to create the first equal-loudness curves helped us understand our own psychoacoustic biases.
Now that you know how Fletcher-Munson curves make sense of loudness, use volume matching to make better mix decisions.
Michael Hahn is an engineer and producer at Autoland and member of the swirling indie rock trio Slight.
@Michael HahnGear guides, tips, tutorials, inspiration and more—delivered weekly.
Keep up with the LANDR Blog.